Having hit a bit of a brick wall with the algebra, I decided to turn to spreadsheet modelling, to simulate buying n boxes of cereal and seeing how many different toys t I obtained. I did this with a macro which randomly selects a letter between A and D (four toys in a set), or between A and F (six toys) or between A and H (eight toys) and so on, and then building up a string of letters based on how many boxes I was buying. For example, with five toys and six boxes, I might obtain:
ABBCAE
My spreadsheet would then check this result, to see if it contains A, B, C, D and E (in this case, there is no D). However, that's only a sample size of one attempt, so I looped the macro to run for 1000 attempts, and measured the number of successes in the 1000, to get a reasonable estimate of the probability of success.
The spreadsheet is available for download here: Probability Spreadsheet (file-sharing website opens in new window).
And the macro, which may not make it successfully to you due to Microsoft Office's security settings, is reproduced here in full:
Sub DoctorWho()
' DoctorWho Macro
' Doctor Who toy probability calculator
' By David Leese
' Define number of toys in the full set = ntoys
' Define number of turns or boxes of cereal = nturns
ntoys = 10
nturns = 50
30 successcont = 0
'measure of success reset to zero
toys = ""
' toys is a text string which will list the letters which have been obtained
newtoy = ""
' newtoy is the randomly-generated toy to add to the list, reset here
For model = 1 To 1000
For cont = 1 To nturns
' cont is a loop counter based on nturns
picklett = Int((ntoys) * Rnd + 1)
' picklett is randomly generated value between 1 and ntoys
newtoy = Chr(picklett + 64)
' newtoy is the letter which corresponds to picklett
toys = toys & newtoy
' append the new toy to the list of existing toys
Next cont
ActiveCell.Value = toys
ActiveCell.Offset(1, 0).Activate
toys = ""
' Insert the value of toys (the full selection) into active cell, move down for the next toy.
Next model
ActiveCell.Offset(-1000, 0).Activate
' Go back to the top of the spreadsheet
End Sub


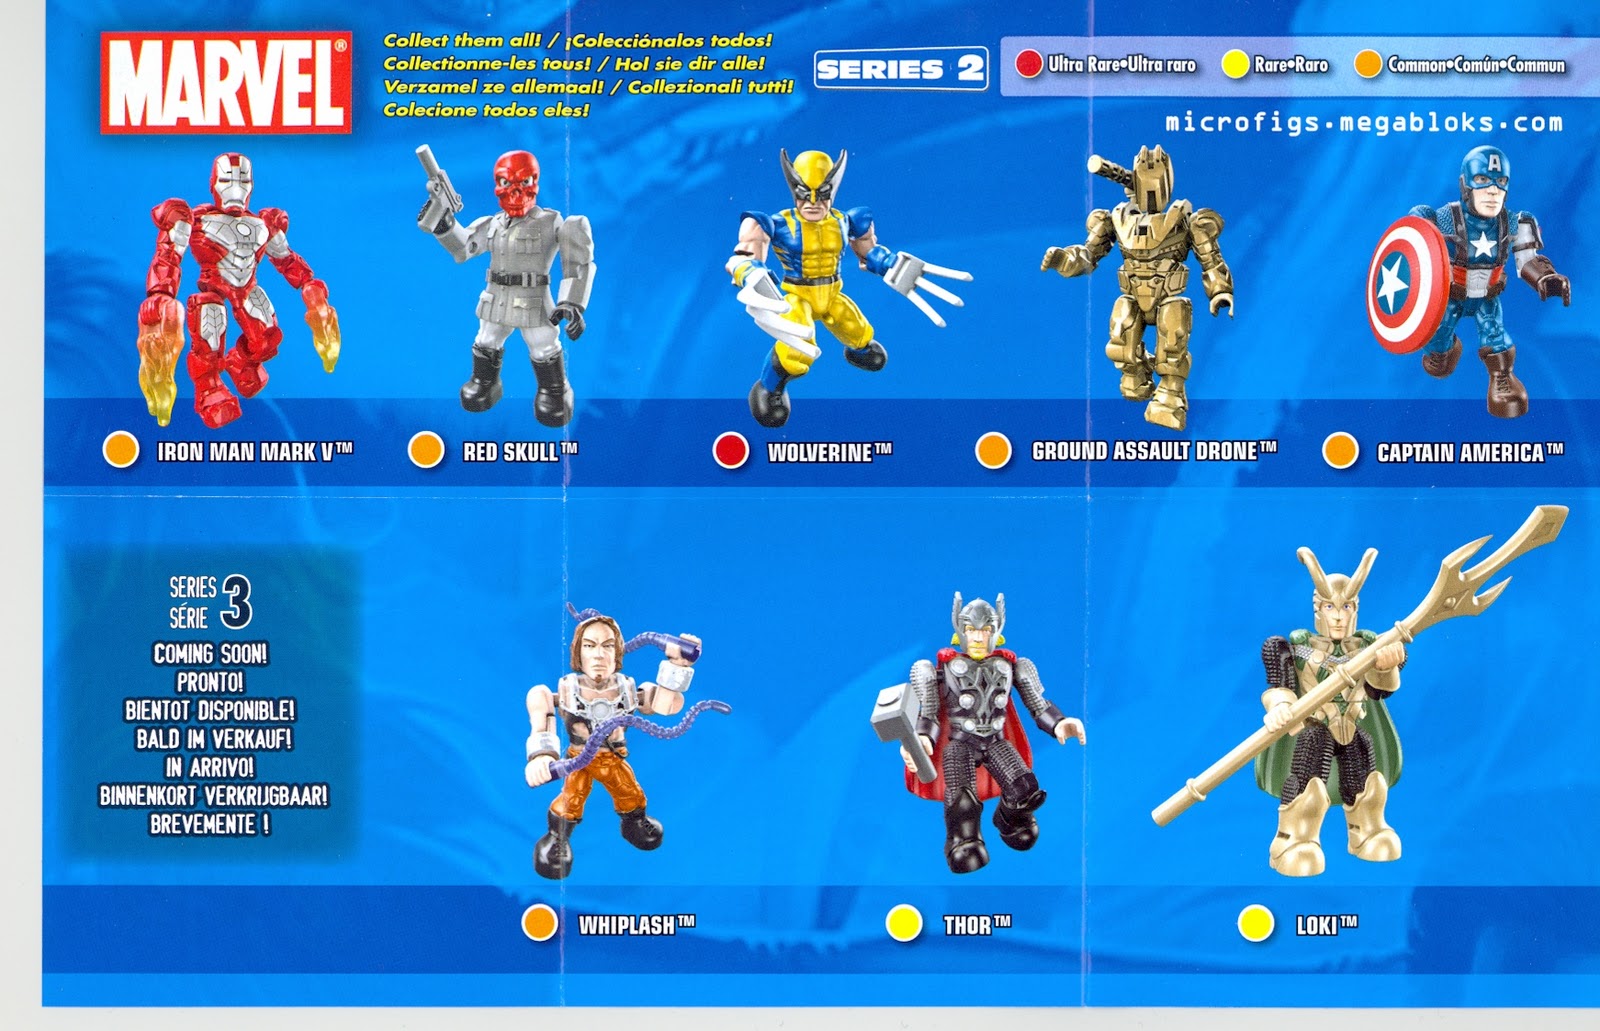
... and to Megabloks' Marvel Superheroes figures, which are shown below.

Anyway, after that brief diversion into the various applications of this spreadsheet and these results, let's take a look at the results and explain what we're seeing.

Key features of the results:
The likelihood of obtaining a complete set grows slowly initially, where n (number of turns) is only slightly larger than t (number of toys in the set). This feature is particularly evident for larger values of t. For small (t < 5) numbers of toys, the increase is sharp, but as t increases, it takes longer for us to observe an increase in p.
As an example, take the results for t=10, the right-most orange line on our graph. Even after 20 tries, the probability of getting a full set is only 20%. Compare this with t=4 where, after 2t tries (8 tries) the probability of getting the full set was over 60%.
A second feature of the graph comes after the slow initial rise, there is a region where the gradient rises, and the probability of getting a complete set increases quickly with increasing n. This makes sense - as you buy more and more packs, you are increasingly likely to find the toys that you're missing. This feature continues until you reach the third phase.
In the third phase, which again only becomes evident for larger values of t, you reach the point where there's only one toy left to find, and it becomes harder and harder to become 100% certain of gaining a complete set. At this point, the probability of obtaining a complete set gets closer and closer to 100%, but never actually reaches it. The p=100% line is an asymptote which our results approach but never reach. Or, to put it another way, if you haven't completed the set of 10 toys after buying 80 bags (or boxes), then buying the 81st isn't going to improve your chances by very much!
That's why there are so many websites devoted to finding, and providing, ways of identifying the toy in the bag before you buy it. For example, an online search for "Lego minifigures codes" will point to sites that show how certain bump markings on the bags indicate the toy inside; for "Megabloks Marvel Minifigures" it's a code printed on the edge of the bag... for Doctor Who, it seems to be a case of feeling for the shapes of the figures inside. All because the real probability of getting a complete set is extremely small - and I haven't even looked at the collections which have 'rare' or 'super rare' figures... that's when it's time to visit eBay!
The Probabilities and Free Toys Series
Part 1: Solving for "What's the probability of getting 10 toys in just 10 packs?"Part 2: Solving for "How many packs do I need to buy to be 50%, 70%, 90% sure of getting all the toys?"
Part 3: Spreadsheet modelling the toys and probability question
Part 4: An elegant solution to 'what's the average number of boxes you'd need to open to get all the toys'?
Part 4: An elegant solution to 'what's the average number of boxes you'd need to open to get all the toys'?
No comments:
Post a Comment