At the start of the first month, there's one pair of rabbits. =1
After the first month, there's one pair of rabbits (and one young pair) =2
After the second month, there are two pairs of rabbits (the original pair, and the young ones have now matured) plus one young pair (from the original couple) =3
After the third month, there are now three adult pairs, and two young pairs (from the two adult pairs) = 5
After the fourth month, there are five adult pairs (three old ones, plus the two from the last generation), and three young pairs (from the three mature pairs last time) = 8
Finally (for this discussion), after the fifth month, there are eight adult pairs (five plus the three new pairs) and five adult pairs = 13 pairs of rabbits.
Let's look at the sequence again...
To start with, we had 1. Then 1 again, then 2, 3, 5, 8, 13.
This sequence is known as the Fibonacci series, after the Italian gentleman who first identified it (Leonardo Fibonacci, 1170-1230). In simple terms: to find the next number in the sequence, add together the previous two numbers.
1 + 1 = 2
1 + 2 = 3
2 + 3 = 5
3 + 5 = 8
5 + 8 = 13
8 + 13 = 21
13 + 21 = 34
21 + 34 = 55
34 + 55 = 89 and so on.
Fibonacci - Mathematics
This sequence grows very quickly - as the rabbit population would - and it has some interesting properties. Firstly, though, it doesn't graph very well on a normal graph scale...

The large values for the later terms in the sequence completely overwhelm the smaller values, so that the first part of the graph looks like a horizontal line. A logarithmic scale on the y-axis will help show the growth in a little more detail. The vertical y-axis now counts 1, 10, 100, 1000 etc with equal spacing.

Which shows something I suspected - we can accurately describe the Fibonacci series as logarithmic.
Let's look at how quickly the series increases, by dividing each term by the previous one.

We can see that the growth rate fluctuates for the first few terms, but after eight terms, settles down considerably, and then reaches a value of 1.618033988749890 after 40 terms. This number is called the Golden Ratio, and it appears in various mathematical (and non-mathematical) situations.
Borrowing from Wikipedia, the Golden Ratio can be defined as...

Rectangle
The ancient Greeks knew of a rectangle whose sides are in the ratio of the Golden Ratio.
It also occurs naturally in some of the proportions of the Five Platonic Solids (the tetrahedron, cube, octahedron, dodecahedron and icosahedron). This so-called Golden Rectangle appears in many of the proportions of that famous ancient Greek temple, the Parthenon, and in the Acropolis in Athens. However, there's no original documentary evidence that this was deliberately designed in. A Golden Rectangle also has visually pleasing proportions, see the larger rectangle below. The horizontal sides are length 1, the vertical sides are lenth 1.61803...
Spiral
The Fibonnaci series can be used to produce a spiral; the title link above shows how this is done. However, to summarise, by drawing squares with sides equal to the terms of the Fibonacci series, adjacent to each other, and by proceeding in a clockwise (or anti-clockwise) manner, it's possible to draw up a connected series of squares. Yes, I'm borrowing from Wikipedia again:

And then draw quarter-circular arcs using the corners of the squares, so that they trace out into a spiral. The area in red below corresponds to the area shown above.

Fibonacci in Nature
Apart from unchecked rabbit populations, the Fibonacci series shows up in a number of natural places - in flower petals, pine cones and so on. My personal favourite is where the Fibonnaci spiral shows up in shells, and I've had this picture on the wall next to my desk for some time. It reminds that even though numbers can get pretty ugly, they can also look remarkably beautiful.

The volume of each chamber within the shell follows the Fibonacci series, all the way out to 3,524,578.
Many other spirals also follow the Fibonacci series. So we can see the Fibonacci series has a wide scope, from the huge to the tiny;overall, though, the Fibonacci series is as simple as 1, 1, 2, 3 :-)
Other maths articles on a similar theme:
The Fibonacci SeriesFibonacci Constants Revisited
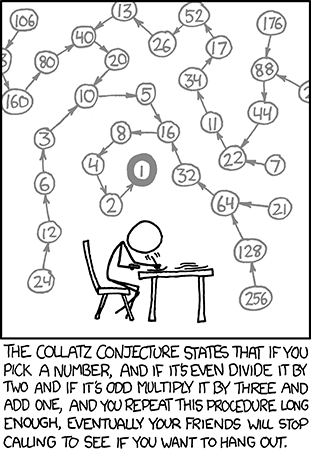
The Collatz Conjecture