Header tag

Tuesday, 7 February 2012

Puzzle: Snakes and Ladders

(also known as the Collatz conjecture, or Syracuse problem)


Courtesy of Calculator Fun and Games, which first introduced me to it, here's an interesting puzzle that is easy enough to understand, but which has developed into a far more complicated problem.  In fact, if you want to make the easy idea hard to understand, just go and read the Wikipedia entry - it is far too complicated, as much of maths on Wikipedia tends to be.


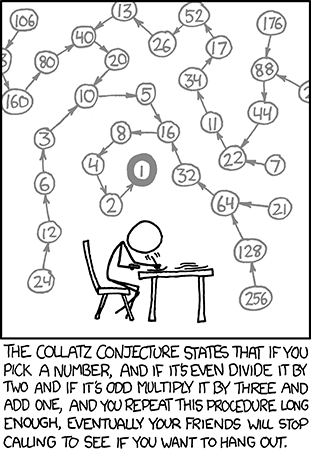
Anyway, here it is: Take a number - any number.  If it's odd, multiply by three and add one.  If it's even, divide by two.  Now take your new number and follow the same process - odd numbers multiply by three and add one, even numbers divide by two.  And so on, and so on.  

What do you find?  And, more importantly, does this always happen?


Let's try a few numbers:
35 is odd, so multiply by 3 ( = 105) and then add 1 = 106
106 is even, so divide by 2 = 53
53 is odd, so multiply by 3 (=159) and then add 1 = 160
160 is even, so divide by 2 = 80
80 is even, so divide by 2 = 40
40 is even, so divide by 2 = 20
20 is even, so divide by 2 = 10
10 is even, so divide by 2 = 5
5 is odd so multiply by 3 and add 1 = 16
16 is even, divide by 2 = 8, which is also even, divide by 2 = 4, then 2, then 1.


If (or should that be "When"?) you reach 1, then you stop.  Otherwise, you get stuck in a loop that goes 1 -- 4 -- 2 -- 1 -- 4 -- 2 etc.


The question is:  Do you always reach 1?  Is there a number out there somewhere that doesn't eventually drop down to 1?


The path length for numbers (how long it takes for a number to reach 1) is not predictable - certainly not easily, as far as I know, and so there's much research there as well.


For example, 26 follows the path 26 - 13 - 40 - 20 - 10 - 5 - 17 - 8 - 4 - 2 - 1


But 27 follows a completely different path...
27, 82, 41, 124, 62, 31, 94, 47, 142, 71, 214, 107, 322, 161, 484, 242, 121, 364, 182, 91, 274, 137, 412, 206, 103, 310, 155, 466, 233, 700, 350, 175, 526, 263, 790, 395, 1186, 593, 1780, 890, 445, 1336, 668, 334, 167, 502, 251, 754, 377, 1132, 566, 283, 850, 425, 1276, 638, 319, 958, 479, 1438, 719, 2158, 1079, 3238, 1619, 4858, 2429, 3644, 1822, 911, 2734, 1367, 4102, 2051, 6154, 3077,9232, 4616, 2308, 1154, 577, 1732, 866, 433, 1300, 650, 325, 976, 488, 244, 122, 61, 184, 92, 46, 23, 70, 35, 106, 53, 160, 80, 40, 20, 10, 5, 16, 8, 4, 2, 1


...with its highest point at over 9,000!  All in all, it has 111 steps in its path to 1.
Image from Calculator Fun and Games
(original was black and white line drawing)
Here are the paths for all the numbers 1-20 (and the numbers that they include):


Image from: "Professor Stewart's Hoard of Mathematical Treasures"

There are various puzzles connected with this problem.  The main one is to prove that all paths end at 1, but that's still not been completely solved yet, and some of mathematics' greatest minds are having a go.


A good alternative, though, is to find the longest path possible for three-digit and four-digit figures.  I'm not sure if it's a puzzle, or a game, and if it's a game, then I figure it'd probably spoil it for you to know the answer before you start :-)


This was my first post on the Collatz conjecture, but I enjoyed investigating it so much that I wrote (and continue to write) a series of articles about variations on it, and you can find them in my Collatz conjecture category.  The next article in the series is Collatz Conjecture 5n+1 and after that, Collatz Conjecture 3n+3.

Monday, 6 February 2012

Puzzle: Magic Square

I'm not entirely sure if this puzzle already has a name... it probably does, but I haven't found it. I think it's probably fair to call it a magic square, since the idea is to use a set of numbers in a square to achieve the same total in the rows, columns and long diagonals.  The difference here is that the numbers are four sets of the numbers 1-4, in four different colours (white, grey, black and yellow), and there's an additional condition that no row, column or long diagonal must have a colour repeated.


To make it easier to explain, here is a set of blocks, showing the four digits 1-4 in their four colours (sixteen blocks in total).


There are a number of solutions to this puzzle, and I have no intention of calculating the number.  Instead, I'm going to look at an example solution, and discuss my thoughts on it, so that - hopefully - you'll be able to solve similar problems in the future.

I was going to insert a few line breaks here, just in case you're included to try and solve the problem without the solution.  

However, I suspect the answer is complicated enough that you won't solve it just by glancing at the answer!

Here's one solution, then:


There are a number of comments I'd like to make on this solution, but before I do, I'd like to introduce (or re-introduce, if you've seen it before) a distance that I call the knight-move.  In Chess, the knight moves by going one square forwards, backwards, or left or right, followed by two squares left, right, or backwards or forwards (at 90o to the original direction) .  Again, it's easier to show with a diagram, so here goes:


This motif shows up a number of times in the magic square puzzle here, and in many other puzzles of the type, "Arrange the numbers so that such-and-such don't appear in the same row or column."  Let's look at the solution again; firstly, here are all the 4s.


Can you see how the 4s are all connected by a knight-move, starting from the four in the top corner?  The sequence grey-yellow-white-black is a series of three knight-moves.

The same applies for any of the other numbers, for example, the 2s start from the bottom right.  The whole solution has rotational symmetry - if you imagine moving the grid around by a quarter turn, then you find the same solution for a different number (1, 4 , 2, 3 in this example).


The same also applies for the coloured numbers - in the next diagram I've highlighted the white numbers.  Starting in the lower right corner with 2, the white numbers are all connected by knight-moves (one across and two up, or two across and one down, etc).


Notice here that one knight move from the white 2 gives the white sequence (shown above), while the other knight move from that 2 gives the sequence for all the other 2s.


So, whenever you encounter any puzzle of the form, "Put the objects into the grid so that each row and column only contains one of each type of object" - whether it's numbers, letters, or shapes, remember the knight-move as a short cut towards the solution!

Sunday, 5 February 2012

Word 3:45 One: Matthew 1

Matthew 1

Matthew begins his gospel with the ancestry of Jesus, all the way back to Abraham.  For a Jew, it was very important that they could demonstrate they were one of Abraham's descendants, and were therefore thoroughbred Jews.  We'll see this frequently in Matthew's gospel.

Most people reading Matthew 1 today don't see the relevance - even taking into consideration that Matthew was demonstrating Jesus' validity as a Jew.  However, Matthew was also demonstrating a key point: God always keeps His promises.  God had made promises to a number of people in the Old Testament, that one day, their descendant would be the Messiah.

Let's look at a few examples:

Abraham
Genesis 12 v 2-3
'I will make of thee a great nation, and I will bless thee, and make thy name great; and thou shalt be a blessing: And I will bless them that bless thee, and curse him that curseth thee; and in thee shall all families of the earth be blessed'.


Judah
Genesis 49:8-10
"Judah, your brothers will praise you; your hand will be on the neck of your enemies; 
   your father’s sons will bow down to you. 
You are a lion’s cub, Judah; you return from the prey, my son. 
Like a lion he crouches and lies down, like a lioness—who dares to rouse him? 
The sceptre [a symbol of royalty] will not depart from Judah, 
   nor the ruler’s staff from between his feet, until he to whom it belongs shall come"


David
2 Samuel 7:16 
"Your house and your kingdom will endure forever before me; your throne will be established forever."


And another more obscure member of Jesus' ancestors:

Zerubbabel (Matthew 1:12.  Zerubbabel  led the work on the reconstruction of Jerusalem from the rubble that was left when the Israelites returned from their exile).

Haggai 2:20-23
 20 The word of the LORD came to Haggai a second time on the twenty-fourth day of the month: 21“Tell Zerubbabel governor of Judah that I am going to shake the heavens and the earth. 22 I will overturn royal thrones and shatter the power of the foreign kingdoms. I will overthrow chariots and their drivers; horses and their riders will fall, each by the sword of his brother.
 23 “‘On that day,’ declares the LORD Almighty, ‘I will take you, my servant Zerubbabel son of Shealtiel,’ declares the LORD, ‘and I will make you like my signet ring, for I have chosen you,’ declares the LORD Almighty.”

The signet ring in Old Testament times was a royal symbol.  A signet, engraved with the king's seal, was used to endorse official documents.  To guard against misuse, the king wore it as a ring or on a necklace.  God declares here that He's chosen Zerubbabel and would keep him safe to fulfil his appointed purpose; since this didn't happen during his lifetime, we can see that this would extend to one of his descendants... and sure enough...

There are quite a few other interesting characters in Matthew 1... and I like to think of it as a roll of honour.

Thursday, 2 February 2012

Probabilities and Free Toys: Part Four

Well, after all the work I've done on probabilities and free toys in 'blind' packaging, such as cereal packets, or toy action figures, it seems like I've missed a neat little trick.  I was reading a maths puzzle in a book a few days ago about this exact problem!  The book in question is called Math-E-Magic, by Raymond Blum, Adam Hart-Davis, Bob Longe and Derrick Niederman.


I couldn't quite believe my luck... and then felt slightly deflated, when I reflected on all the number-crunching that I've done so far, and how I did not see this alternative approach (although it doesn't give the same degree of detail in its solution).
The puzzle is posed thus: "Cereal Serial: A cereal company places prizes in its cereal boxes.  There are four different prizes distributed evenly over all the boxes the company produces.  On average, how many boxes of cereal would you need to buy before you collected a complete set?"


This is a slightly different approach than I've been using (how many boxes to achieve 90% probability of getting a full set), which makes the maths easier, but the solution - one 'average' figure - gives no indication of the spread of results, which I achieved previously.


The answer, however, is elegantly simple.

To obtain the first toy, we need to buy just one box, as we are guaranteed to get a toy we haven't had before.  

For the second toy:  we have a probability of 3/4 of getting a new toy in the second box.  Therefore (and this is a big therefore which will need explaining separately), it'll take on average 4/3 boxes to obtain a new toy.
For the third toy, the probability of getting a new toy is 2/4 or 1/2, and therefore it will take an average of 2 boxes to get a toy we haven't had before.
And finally, for the fourth toy, the probability of getting a new toy is 1/4, and it will therefore take four additional boxes to get the final toy.

So, the average number of boxes it will take to get the four toys is:
1 + 4/3 + 2 + 4 = 8 1/3

To quote the answers from Mathemagic:  "In real life, of course, you can't buy 1/3 of a box, but that is still the average number of boxes you'd have to purchase."


As I said, I'm not familiar with the approach of taking reciprocals to obtain "number of boxes" from probabilities, although it seems intuitive.  I must have missed that lesson at school!  Let's take a look at it a little more closely.


If an event has a 1/4 probability of success, then how many times do I have to repeat it, on average, to achieve one success?  It seems overly simple to say "Four times" but that appears to be the answer - certainly, the answer given in Mathemagic works on this principle.  And logically, it makes sense.  If we were to try to measure the probability of a success event (without knowing what the probability was) then we'd take the number of successes and divide by the number of attempts.  If we were successful once in four tries, then p(success) = 1/4.  And on average, working backwards to reach the answer we're looking for, we'd expect one success in four attempts.  I will bear all this in mind next time I find a free toy inside a cereal packet... especially if it's one of a set of 16!


Let's take a look at the results from last time, and see if they can be used to confirm or support this calculation.

Firstly, here are the results with number of tries along the x-axis, and probability of success on the y-axis.  Each line represents a different number of toys in the set (two toys on the left, ten toys is the right-most).

Let's take a look at the slopes for each graph - to make things easier to see, let's just look at the cases t = 2, 3, 4 and 5.


Here are the graphs of dp/dn or how the gradients of the graphs above change with number of tries.  As I pointed out last time, the graphs have a region of maximum slope - where the probability of getting the full set of toys rises most sharply.  This is the region where we will approach the average number of boxes we need to buy, so, by finding the slope of the graph (in this case I've just subtracted adjacent figures to determine the change in probability, since I haven't got the actual function to differentiate).

What does this show us?  For toys=2, maximum slope is at n=2 (where the probability goes from zero to 50%), but the more meaningful result is at n=3 where the probability goes from 50% to 75%.  Beyond this, the slope tails off very quickly.

This result also matches the formulaic approach shown above:  
Probability of 'new' toy with one box = 1 so 1/1 =1 number of boxes to be bought.
Probability of 'new' toy with second box = 1/2, so 1/ (1/2) = 2 boxes to be bought.
1+2 = 3 
Average number of boxes for a two-toy set is three boxes.

Let's re-examine t=4, which we discussed at the start of this post.  My results graph shows a peak around n=7~8 which is in good agreement with the arithmetic figure of 8 1/3.  I'm not sure if this validates my method or the solution :-)  but it's good to see some agreement between practical experiment and calculated figures.

Finally, let's look at t=5, the purple line on my graph.
Mathematically, the average number of boxes will be:

1 + 1 1/4 + 1 2/3 + 2 1/2 + 5 = 11 5/12 or just under 11.5 boxes (11.41667).

However, the peak for t=5 on my graph is at n=9 boxes, and this (along with the results for t=4) seem to suggest an oversimplification in the calculated method that I've been using.  I just can't quite put my finger on it, or explain it clearly and concisely!  


Perhaps I've made a mistake in the analysis of my data.  Recalling my maths lessons at school, I suspect that the 'average' number of boxes is obtained when the probability of collecting the full set of toys is equal to (or slightly greater than) 50%.

Reviewing my data, this gives:


Which still shows an over-estimation by the arithmetic method (or an over-achievement by the modelling approach).  Consequently, I still feel a little concerned with the arithmetic method.  I think it's related to the probability of getting a new toy when you've already collected half the set and you're starting to get fewer successful 'new' toys, but I can't quite identify if there's a flaw in the model or in my results.  I would leave it as: when you come to find the final toy in a set of five, having already bought six boxes for the first four, is it really going to take FIVE more boxes?  Somehow, that doesn't feel right (although, as I've read previously, human beings are very poor judges of probability).

I'd really like to reach closure with this puzzle... I think I may take the mathematical approach for now, and re-examine my data at a later time!!

Friday, 27 January 2012

Probabilities and Free Toys: Part Three

In my previous posts, I've been looking a practical problem in probabilities.  Namely, if a breakfast cereal manufacturer gives away free toys with each cereal packet, how many cereal packets do I have to buy in order to be fairly sure (90% probability) of obtaining each toy in a set?  This of course, depends on how many toys there are in the set, and I've been crunching through the maths as far as possible for smaller numbers of toys.  


Having hit a bit of a brick wall with the algebra, I decided to turn to spreadsheet modelling, to simulate buying n boxes of cereal and seeing how many different toys t I obtained.  I did this with a macro which randomly selects a letter between A and D (four toys in a set), or between A and F (six toys) or between A and H (eight toys) and so on, and then building up a string of letters based on how many boxes I was buying.  For example, with five toys and six boxes, I might obtain:


ABBCAE


My spreadsheet would then check this result, to see if it contains A, B, C, D and E (in this case, there is no D).  However, that's only a sample size of one attempt, so I looped the macro to run for 1000 attempts, and measured the number of successes in the 1000, to get a reasonable estimate of the probability of success.


The spreadsheet is available for download here:  Probability Spreadsheet  (file-sharing website opens in new window).


And the macro, which may not make it successfully to you due to Microsoft Office's security settings, is reproduced here in full:

Sub DoctorWho()


' DoctorWho Macro
' Doctor Who toy probability calculator
' By David Leese


' Define number of toys in the full set = ntoys
' Define number of turns or boxes of cereal = nturns
ntoys = 10
nturns = 50


30 successcont = 0
'measure of success reset to zero


toys = ""
' toys is a text string which will list the letters which have been obtained
newtoy = ""
' newtoy is the randomly-generated toy to add to the list, reset here
   
   
For model = 1 To 1000
    For cont = 1 To nturns
    
        ' cont is a loop counter based on nturns
        picklett = Int((ntoys) * Rnd + 1)
        ' picklett is randomly generated value between 1 and ntoys
        
        newtoy = Chr(picklett + 64)
        ' newtoy is the letter which corresponds to picklett
        toys = toys & newtoy
        ' append the new toy to the list of existing toys


    Next cont
ActiveCell.Value = toys
ActiveCell.Offset(1, 0).Activate
toys = ""
' Insert the value of toys (the full selection) into active cell, move down for the next toy.
Next model


ActiveCell.Offset(-1000, 0).Activate
' Go back to the top of the spreadsheet


End Sub


Why is the macro named after Doctor Who?  Well, apart from working for cereal packets with toys, this also works for the current (and previous) series of Character Building Doctor Who toys, and this is where I got my first inspiration for this post (and which reminded me of the cereal packet question which I was asked at school, all those years ago).


 It also applies to Lego's Minifigures ranges...


... and to Megabloks' Marvel Superheroes figures, which are shown below.


Anyway, after that brief diversion into the various applications of this spreadsheet and these results, let's take a look at the results and explain what we're seeing.


Key features of the results:


The likelihood of obtaining a complete set grows slowly initially, where n (number of turns) is only slightly larger than t (number of toys in the set).  This feature is particularly evident for larger values of t.  For small (t < 5) numbers of toys, the increase is sharp, but as t increases, it takes longer for us to observe an increase in p.


As an example, take the results for t=10, the right-most orange line on our graph.  Even after 20 tries, the probability of getting a full set is only 20%.  Compare this with t=4 where, after 2t tries (8 tries) the probability of getting the full set was over 60%.


A second feature of the graph comes after the slow initial rise, there is a region where the gradient rises, and the probability of getting a complete set increases quickly with increasing n.  This makes sense - as you buy more and more packs, you are increasingly likely to find the toys that you're missing.  This feature continues until you reach the third phase.


In the third phase, which again only becomes evident for larger values of t, you reach the point where there's only one toy left to find, and it becomes harder and harder to become 100% certain of gaining a complete set.  At this point, the probability of obtaining a complete set gets closer and closer to 100%, but never actually reaches it.  The p=100% line is an asymptote which our results approach but never reach.  Or, to put it another way, if you haven't completed the set of 10 toys after buying 80 bags (or boxes), then buying the 81st isn't going to improve your chances by very much!


That's why there are so many websites devoted to finding, and providing, ways of identifying the toy in the bag before you buy it.  For example, an online 
search for "Lego minifigures codes" will point to sites that show how certain bump markings on the bags indicate the toy inside; for "Megabloks Marvel Minifigures" it's a code printed on the edge of the bag... for Doctor Who, it seems to be a case of feeling for the shapes of the figures inside.  All because the real probability of getting a complete set is extremely small - and I haven't even looked at the collections which have 'rare' or 'super rare' figures...  that's when it's time to visit eBay!

The Probabilities and Free Toys Series

Part 1:  Solving for "What's the probability of getting 10 toys in just 10 packs?"
Part 2:  Solving for "How many packs do I need to buy to be 50%, 70%, 90% sure of getting all the toys?" 


Tuesday, 10 January 2012

Web Analytics: Personalisation

Last Friday night, I had to transfer some money from my savings account to my current account, and in the process encountered an interesting case of personalisation.


Withdrawing the cash from the savings at the building society was a typically anonymous matter, even though I had to provide my account passbook and photo ID, but this only became apparent when I paid the money into my bank, just across the road.  I only had to provide the money and the debit card for my bank account, but as soon as my card had been scanned, the bank clerk began addressing me as David, and just by doing that, provided a much more personal service.


Earlier in the evening, I phoned the local take-away restaurant, and on the way back from the bank, I called in to pick up my order. I'd called them from my home landline, but hadn't provided a name or address.  However, I've ordered from the take-away before, and they'd evidently stored my data: at the top of the receipt for my order were my full name and address.  As I mentioned, I hadn't provided any information at all when I phoned the order through.  Was it surprising to see my name and address on the receipt?  Absolutely. Was it un-nerving?  Perhaps, but it's more a reflection of a local business using data and information to their advantage.  I don't know if they're going to use my purchase preferences to offer me particular choices or offers next time I order... I'll let you know.


Online, I'm not surprised when Amazon, or eBay, or any other e-commerce site, uses my login details and my activity on their site to try to provide me with relevant content or advertising.  So I've been searching for a particular author, or a particular album, movie or laptop - should I really be surprised that they've noticed, and now they're using the promotional space on their sites to show me advertising of similar products?  Is this scary new technology?  Or is it something that's been around for many years, and this is just its newest incarnation?


Back when I was at high school, I had a part time job as a sales assistant at the local shoe store.  It was easy enough - serve the customers, keep the shop floor well-stocked, tidy away surplus stock into the storage room.  Part of the sales training (it wasn't extensive) was to try to cross-sell - shoelaces, polish, all that stuff, and to sell to customers when we didn't have what they wanted.  For example - "Do you have this shoe in my size?"  A quick trip to the stock room would reveal that we didn't, but a check around the shelves would show that we had it in blue, or brown instead.  Or perhaps, if it was a shoe that looked like it was for the office, did we have a similar style.  Was it good customer service?  Was it personalisation?  I would certainly hope so, as it led to me selling many pairs of shoes (and frequent declines, but that was part of the job).  Did customers question how I'd manage to come with potential alternatives?  Did they marvel at the apparent depths of the stock room, or think it was freaky or scary that I'd been able to anticipate their needs, based on just one query?


Perhaps, then, we shouldn't be surprised, or alarmed, when a computer algorithm looks at our on-site browsing habits and tries to provide us with what we appear to be searching for.

Thursday, 5 January 2012

Film Review:Tron

"User requests are what computers are for."
"Doing our business is what computers are for!"
Walter, the voice of reason, and Dillinger, the megalomaniac's voice of capitalism.


Tron could probably be described as the predecessor, or at least influential in, many films that we've seen since.  However, I haven't seen it until now.  For a so-called sci-fi fan, that's quite a confession, but it's true.  Courtesy of Lovefilm, however, that oversight has now been rectified, and I'm quite pleased with the result!


Upon first inspection, Tron is dated, and shows its age; however, the storyline and the plot have managed to remain current - in fact, any 'over-powered computer gains sentience and takes control' story probably owes its existence to Tron, and Terminator's Skynet is a prime example.  Other derivatives include the Matrix, The Net, and Hackers, to name a few.


Tron is also a great film if, like me, you like to play "What have they been in?" with the actors.  Apart from Jeff Bridges (who went on to feature in Starman, among others), Tron also features Bruce Boxleitner (Bablyon 5's John Sheridan), a very young-looking Peter Jurasik (Londa Mollari from Babylon 5, already with that unmistakeable voice), and David Warner (I recognised him as Chancellor Gorkon from Star Trek 6, The Undiscovered Country, but according to IMDB he was also in Bablyon 5 as well).


My misunderstanding of Tron led me far enough to believe that the grid-based vehicle 'game' that the occupants are forced to play was Tron; in fact, the title goes to Bruce Boxleitner's character, a rogue program introduced to cause trouble in the mainframe computer.  Yes, it's 1980s computer-speak all the way.  Otherwise, it's a CGI-fest covering a fairly straightforward adventure story... kinda reminds me of the Matrix, or Star Wars Episode 1.  It is genre-defining, it's fresh and new (for its day) and makes much of the recent stuff look derivative.  Somebody - I wish I could recall who - said that watching the later instalments of the Matrix trilogy were a lot like watching somebody else play a computer game.  There are occasional moments of that here with Tron, but these are fairly infrequent.


Overall, I liked Tron.  Yes, it's a lot of CGI and pretty graphics, but there is a story - two in fact - to be told, and I have to say that the 'real world' story was at least as interesting as the virtual one... it certainly had the more three-dimensional characters!